You’ll never know it’s there until you need it.
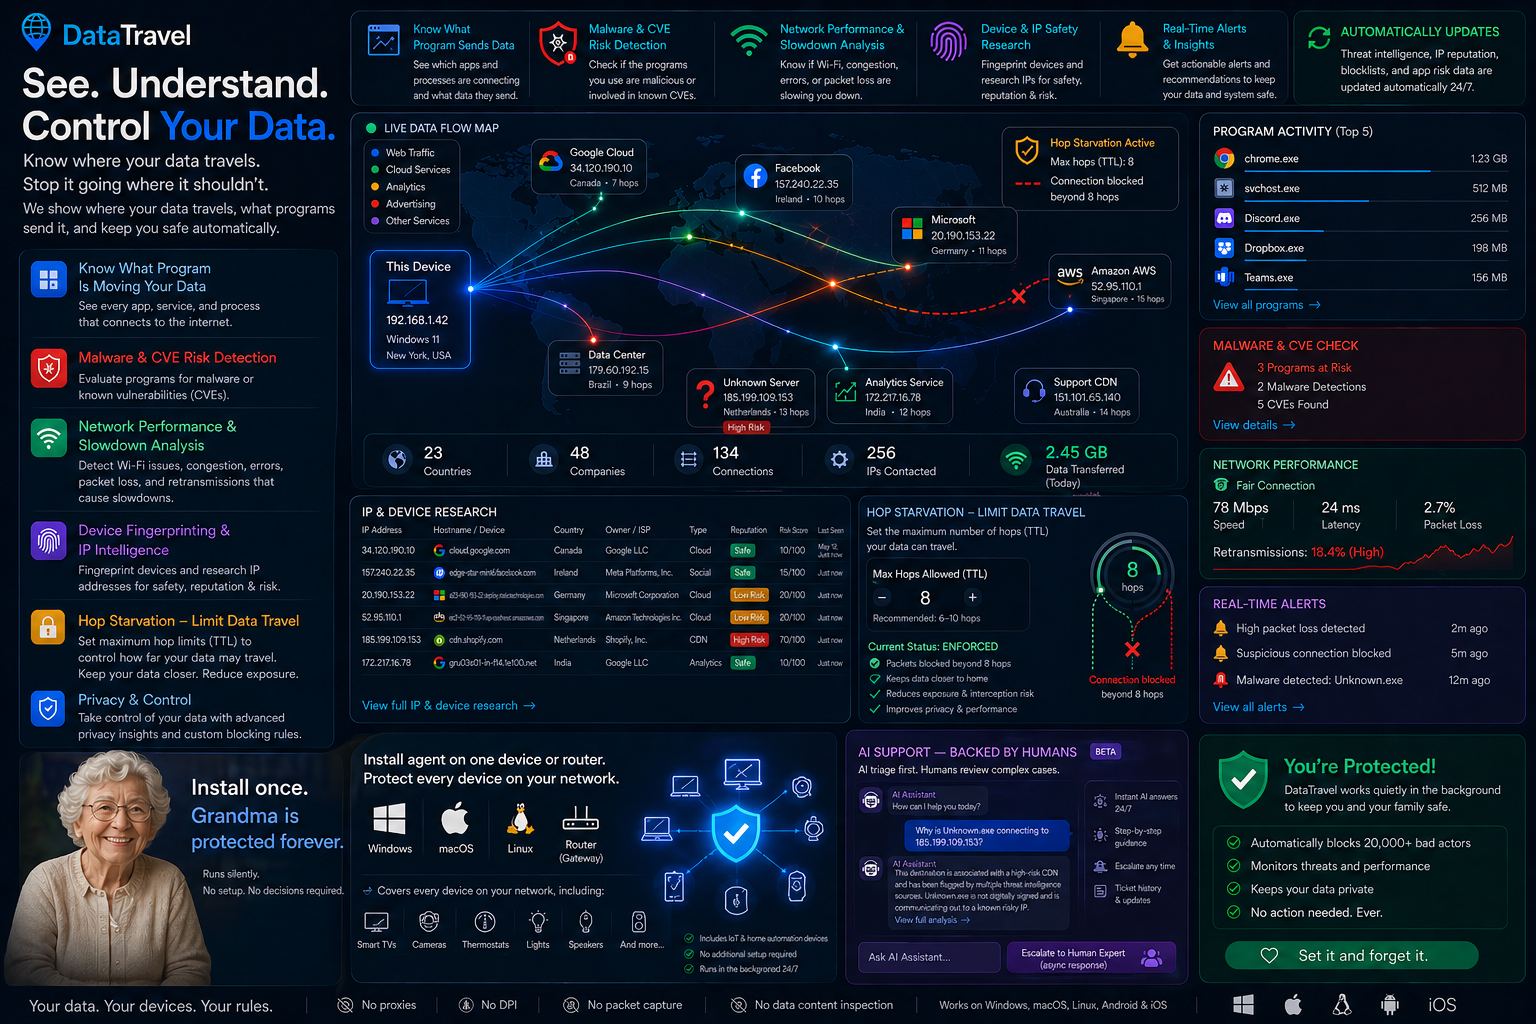
A DataStun agent gives every device its own forensic network feed — every destination it reached, when, for how long, how much data moved, and the exact program on disk that opened each session. Every IP gets graded A to F. 20,000+ known bad actors are refused at your endpoint before the first packet leaves.
The dangerous part of the internet is tiny — about one-third of one percent of addresses — and it changes about every minute. Bad software outnumbers good by about twenty to one, with five new threats a second. We don’t try to chase it all — we recognize what’s legitimate, refuse the worst instantly, and catch the rest as it appears.
We analyze only metadata — addresses, names, ports, bytes, process names. Packet contents are never inspected. The kind of answer network engineers used to need a $20,000 analyzer for, delivered to every user by default.
New to this? The managed beta is the no-setup way to try it — install one machine, we run the rest.
Simple enough for grandma, admired by the CTO.

One pin per IP your fleet has talked to. Click any pin in your dashboard to see the cert, the ASN, the AI assessment, and every device that reached it.
“Pandemics spread at the speed of an airplane. Computer viruses spread at the speed of light.”
That’s why we built DataStun. A blocklist someone updated last week can’t keep pace with a threat that moves at the speed of light — so our protection updates around the clock and catches new dangers the moment they appear.
Capabilities that, individually, exist somewhere. Combined under one agent, on one dashboard, you’ll find them nowhere else.
DataStun runs on three co-equal lanes — security, performance, and data sovereignty — from a single lightweight background process. Same capabilities on Individual as on Enterprise; tiers buy scale, retention, and advanced fleet analytics, never basic functionality.
What your machine is talking to, who it is, and whether it should be allowed.
svchost.exe in %TEMP% announces itself the moment it opens a socket.Passive grading from kernel-native readings. No synthetic probes, no proxy, no bandwidth taxed.
Where your data goes, by country and by org, and how to physically prevent it from going where it shouldn’t.
DataStun is a service you run yourself. You appoint your own admins; they manage every agent — and an agent is simply an endpoint, one of your computers, servers, or workstations. That is the whole idea: a managed service where you can be your own M. Want a professional organization to run it instead? Hand it to an MSSP. Want to take it back in-house once you know the system? Take it back. Same platform, same data, your choice — and the switch either direction is easy.
Stand up a tenant, name your admin or admins, and they watch every agent across your fleet from one dashboard. They see where every IP you talk to goes, where every IP that tries to reach you comes from, and which program opened each session. Running DataStun is educational — you learn your own network as you go, one clear answer at a time.
Prefer to hand the day-to-day to specialists? A managed security service provider runs your account for you — parent/child tenancy, inherited roles, cross-customer views. Many customers start self-managed to learn the system, then bring in an MSSP later; others start managed and take it in-house once they are comfortable. The transition runs either direction without re-deploying a single agent.
Start on the Individual tier, upgrade when you outgrow it. Every tier uses the same agent and the same security model.
Install an agent on your laptop or home router and see every service it talks to. Spot the IoT device phoning home, the shadow extension syncing across browser reinstalls, the smart-TV vendor siphoning telemetry overseas. The 20,000+ blocklist is already protecting you; you get to see everything else.
Fleet-wide visibility across Windows, macOS, Linux, and gateway devices. Process-level attribution tells you exactly which application on which device reached that grade-F destination. Out of 10,000 machines, the retransmission-rate chart points you at the 30-40 that are actually struggling. Deploy in an afternoon; report in a boardroom tomorrow.
Managed security service providers get parent/child tenancy with inherited roles, white-label option, and a cross-customer aggregate view. Custom contracts — for regulated environments, data-residency requirements, and strategic partnerships — layer in geographically separated reputation storage and federation peering on top of the standard Enterprise tier.
The full capability set. Same agent on every tier; tiers gate scale, retention, and advanced features.
Every TCP session links to the full path of the .exe on disk that opened it. We capture the PID at the moment of connect, resolve it to the image path, and attribute every byte in and out of the session to that program. If malware lands on a fleet machine, its executable announces itself here — the name, the command-and-control destination, the data moved. Nothing else in the industry closes this loop today.
Ransomware, C2, malware hosts, dark-web infrastructure — curated from industry-leading threat-intel feeds and our own reputation pipeline. Enforced by the agent at the Windows Firewall / iptables / pfctl layer. Every blocked entry carries source attribution, so the dashboard can show you who named the listing and link directly to the dispute path when a destination you actually use ever lands on the list. No middlebox, no rule maintenance, and the list updates itself.
A 12-stage pipeline scores every destination: TLS certificate inspection, cipher strength, geographic risk, service-category classification, active probing from a separate investigator, known-bad feed matching, AI-assisted verdict. Letter grade plus full evidence trail. D and F destinations are added to the blocklist automatically so the next connection attempt from any agent on any tenant is stopped.
Every TCP session your devices run gets a kernel-native latency reading and a retransmission count. We roll those into one verdict per device, one per app, and a 24-hour timeline — all in plain English: Excellent means under 50 ms latency and under half a percent retransmits, Poor means something’s genuinely wrong. Then we rank the whole fleet so the slowest 10 machines surface immediately. No synthetic probes, no proxy, no bandwidth taxed — we just expose what the kernel already tracks. See passive performance grading →
Every TCP session is accounted for: bytes in, bytes out, duration, peak throughput. Rolled up by process, by port, by destination. When a user says “Teams is slow this week,” you can prove whether Teams actually moved less data or whether something else is saturating the pipe. Byte counts come from TCP sequence arithmetic on the wire — ground truth, not NIC counters that can lie.
QUIC runs on UDP port 443 and carries HTTP/3, Microsoft 365, most Google and Cloudflare traffic. Traditional tools read the kernel socket table, which does not expose UDP remote endpoints, so they see nothing. We capture QUIC at the packet layer, parse INITIAL packets, and extract SNI and ALPN from the TLS ClientHello for every session. In 2026 most of your traffic speaks QUIC — if your tooling does not see it, you are flying blind.
Every flow gets its destination mapped back to the hostname your application actually asked for, from the OS’s own DNS resolver cache. You see the name (cdn.example.com), not just the IP (185.13.22.9). This is how you catch dynamic-DNS beacons, fast-flux command-and-control, and services pretending to be something they are not.
Cap the TTL on outbound packets to a destination so they expire at a router of your choosing. The destination becomes unreachable; an ICMP time-exceeded comes back naming the router that killed the flow — proof the rule worked AND a map of your upstream routing. Denial at the endpoint, no middlebox, reversible in seconds. Business tier and above, $10/agent/month.
Databases, file shares, admin APIs, message queues — 169 services across 8 categories that should never answer on the public internet unless you’re inside a VPN. The agent checks every outbound flow against this catalog on flow-open; a database query to a public IP fires a critical match with the .exe name, the PID, and the destination attached. Tenant admins get an immediate notification and a one-click Block this destination that pushes a firewall rule to every agent on the tenant within 60 seconds. SSH and 443-served admin panels (iLO, vCenter, Grafana) land as warn — visible in the dashboard, no pager. Included on every tier.
Knowing which .exe opened a session is already powerful. Knowing what that executable actually is — verified against the signing publisher and cross-checked with external malware databases — is the next step. The agent computes a SHA-256 of every binary that opens network connections, extracts the publisher’s signing identity (Authenticode on Windows, codesign on macOS, package-manager ownership on Linux), and sends those observations to our reputation system.
Our reputation service runs the shortcut first: if the binary is signed by a trusted publisher — Microsoft, Google, Apple, Adobe, and ~40 other names on a curated list — with a valid signature, we mark it signed_trusted and move on. Everything else gets a hash lookup against curated malware-sample repositories first (decisive on known malware), then a broad multi-engine malware-database query (70+ AV engines aggregated). Verdicts land on the dashboard as letter grades — F on malware hits, D or C on mild concern, B on widely-scanned clean binaries.
We never upload your binaries. Hash-only lookup is how we get verdicts on known files; if a hash is unknown to every external service, we mark it unknown and surface it on your dashboard so the tenant admin can review. If you decide you want deep analysis, you upload the file yourself to a service of your choice, from your own machine, as your own explicit act — DataStun’s code has no upload path to third-party analyzers, by design. That rule is hard, not a setting.
Email or webhook alerts when conditions match — grade-F destination hit, agent goes offline, retransmission rate spikes, exposed-service detected. HMAC-signed webhook bodies so your SIEM can verify provenance. Per-day deduplication per rule so a persistently bad flow sends one notification, not a thousand. Business and above.
The DataStun agent already sees DNS resolutions, the executable behind every session, and the bytes moved each direction. Catalog 50+ known AI providers (Anthropic, OpenAI, Microsoft Copilot, GitHub Copilot, Google Gemini, xAI Grok, Cursor, Perplexity, Mistral, Cohere, Hugging Face, Ollama, DeepSeek, Meta AI, plus the long tail) and the Intel → AI tab turns on a single load-bearing number per provider per device: bytes uploaded. That's the metric governance teams actually need: how much data left your perimeter for which AI vendor, sent by which application, on which machine, on which day.
Pretty powerful when it's institution-wide. You see Anthropic adoption climbing across engineering, the OpenAI consumer ChatGPT app showing up on the marketing team's machines, an unsigned executable in %TEMP% uploading to a vendor nobody approved. All from metadata your agent collects anyway — no DPI, no proxy, no MITM, no content inspection. TLS hides the prompts and responses — this is the volume-and-attribution view, not a DLP. Included on Business tier and above (Individual and Tribe see only their own agents’ AI activity, not the cross-fleet rollup).
When something goes wrong, the tray’s Help button opens a conversation scoped to that agent. An AI assistant answers first, with commands the user can copy into their own elevated shell — never remote execution. Stuck? Escalate to the tenant admin with one click and the entire conversation (including what the AI tried) lands in their inbox, with an email ping. Admins reply in the same thread. Every message is scrubbed on the endpoint before transit: credit cards, API keys, private-key PEM blocks, password-field patterns are replaced with [REDACTED:…] markers the user can see so they know what didn’t leave their device. Included on every tier.
Findings from real DataStun deployments. Your first week will look something like this.
A binary named svchost.exe was running out of %USERPROFILE%\AppData\Local\Temp and holding a 6-hour TCP session to an IP in Moldova. The legitimate svchost.exe lives in C:\Windows\System32. The path mismatch lit up the process-attribution card on the first dashboard load — before any antivirus on that machine had flagged it.
AmazonPlug0600 was sending telemetry to 121.199.69.55 in Hangzhou, China. No TLS, no identity, grade C−. The household had never heard of this service.
A crypto-wallet extension kept reappearing after OS reinstalls because Microsoft cloud sync silently restored it. The extension polled api.coinbase.com every two minutes. Caught because the reputation pipeline flagged the extension’s fallback endpoint as grade D.
A production server was using Kubernetes’ default self-signed certificate instead of its real one. TLS 1.3, but the chain was fake. Grade B−. Caught within an hour.
DataStun sits alongside your existing endpoint protection, not on top of it. Findings carry the metadata your SOC playbooks already speak: standard severity levels (Critical / High / Medium / Low / Info), MITRE ATT&CK technique IDs, and an open Common Schema export so a finding from us slots into a Microsoft Sentinel or Splunk runbook the same way the rest of your tooling does.
HMAC-signed JSON to any HTTPS endpoint. RFC 5424 syslog over TLS to your collector of choice. Per-finding severity, MITRE technique tag, and a stable finding ID for downstream automation deduplication.
Findings emit in an open schema covering process, network, and alert categories — any tool that already speaks the schema can ingest without a custom parser.
Native connectors are on the way. Until they ship, the webhook + syslog forwarders cover every modern logging hub. Tell us which one you need and we’ll prioritize.
DataStun is not an endpoint-protection replacement — it’s the network-observability layer your existing endpoint product doesn’t have. Cross-correlation with major endpoint vendors is in design; speak to us about your stack.
Severity levels follow the standard Critical / High / Medium / Low / Info scale (shown alongside our human-readable A–F grades). MITRE ATT&CK technique mapping ships with every finding type by mid-2026.
Start on the Individual tier — up to 10 agents with 30 days of history. Every plan includes a generous 30-day trial; you’re not charged until it ends.